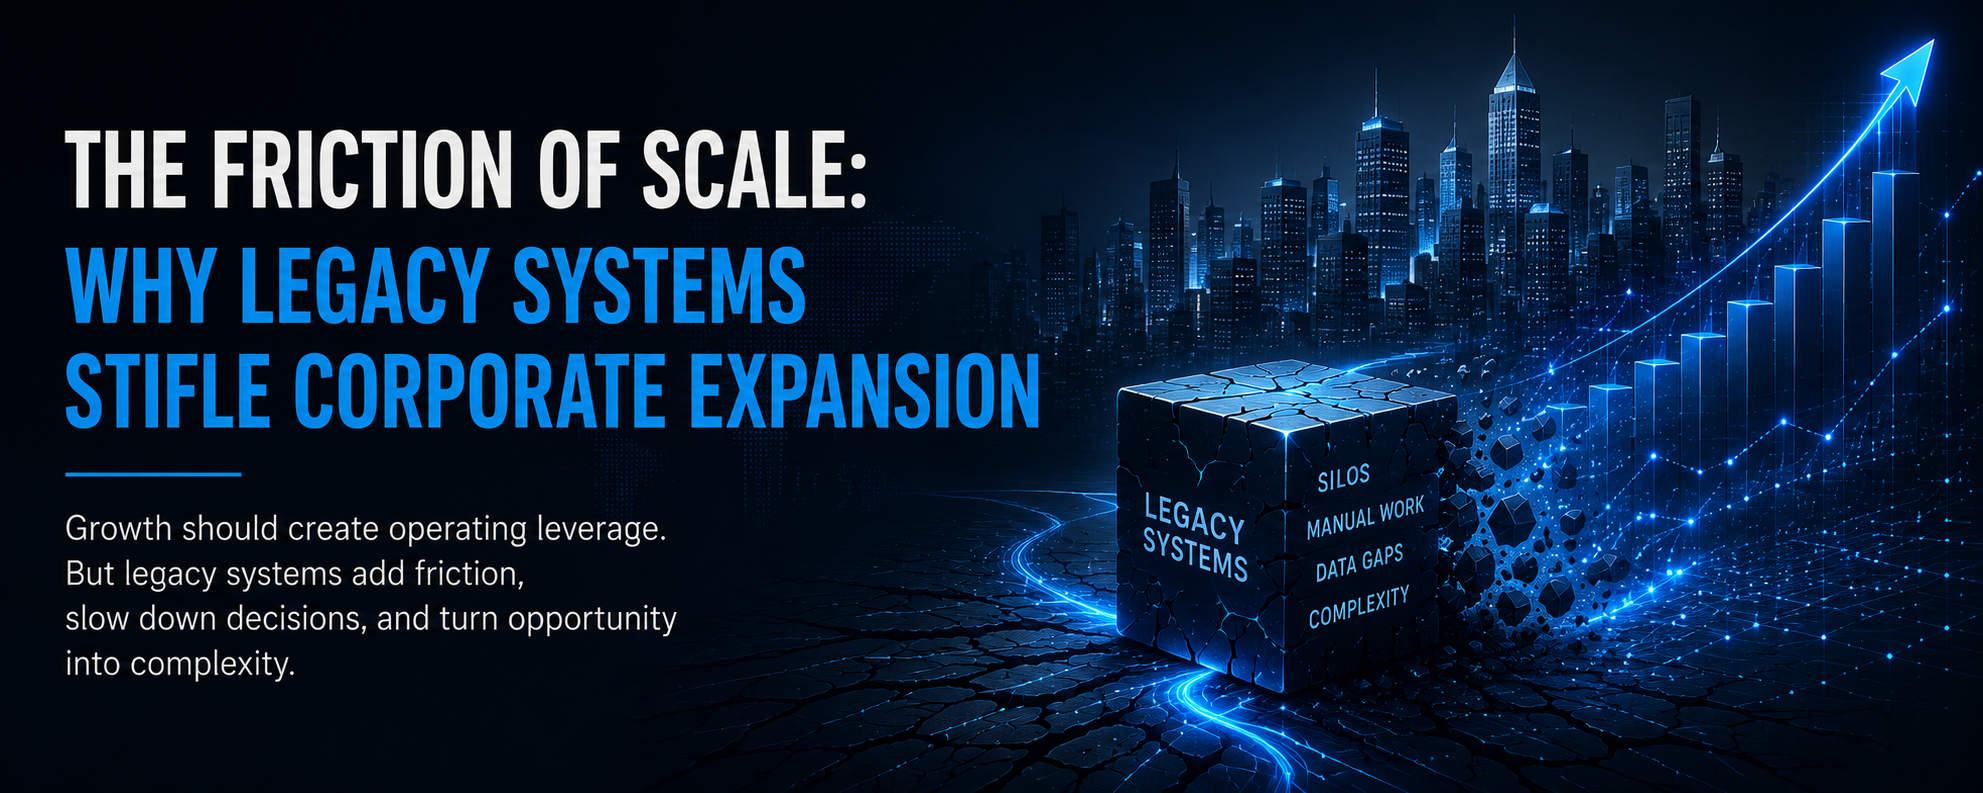
The Hidden Cost of Slow Cash
In corporate financial governance, revenue is a vanity metric, while cash flow is sanity. Yet across the mid-market landscape, executive teams routinely celebrate record top line growth while their treasury functions struggle to fund basic operational expansion.
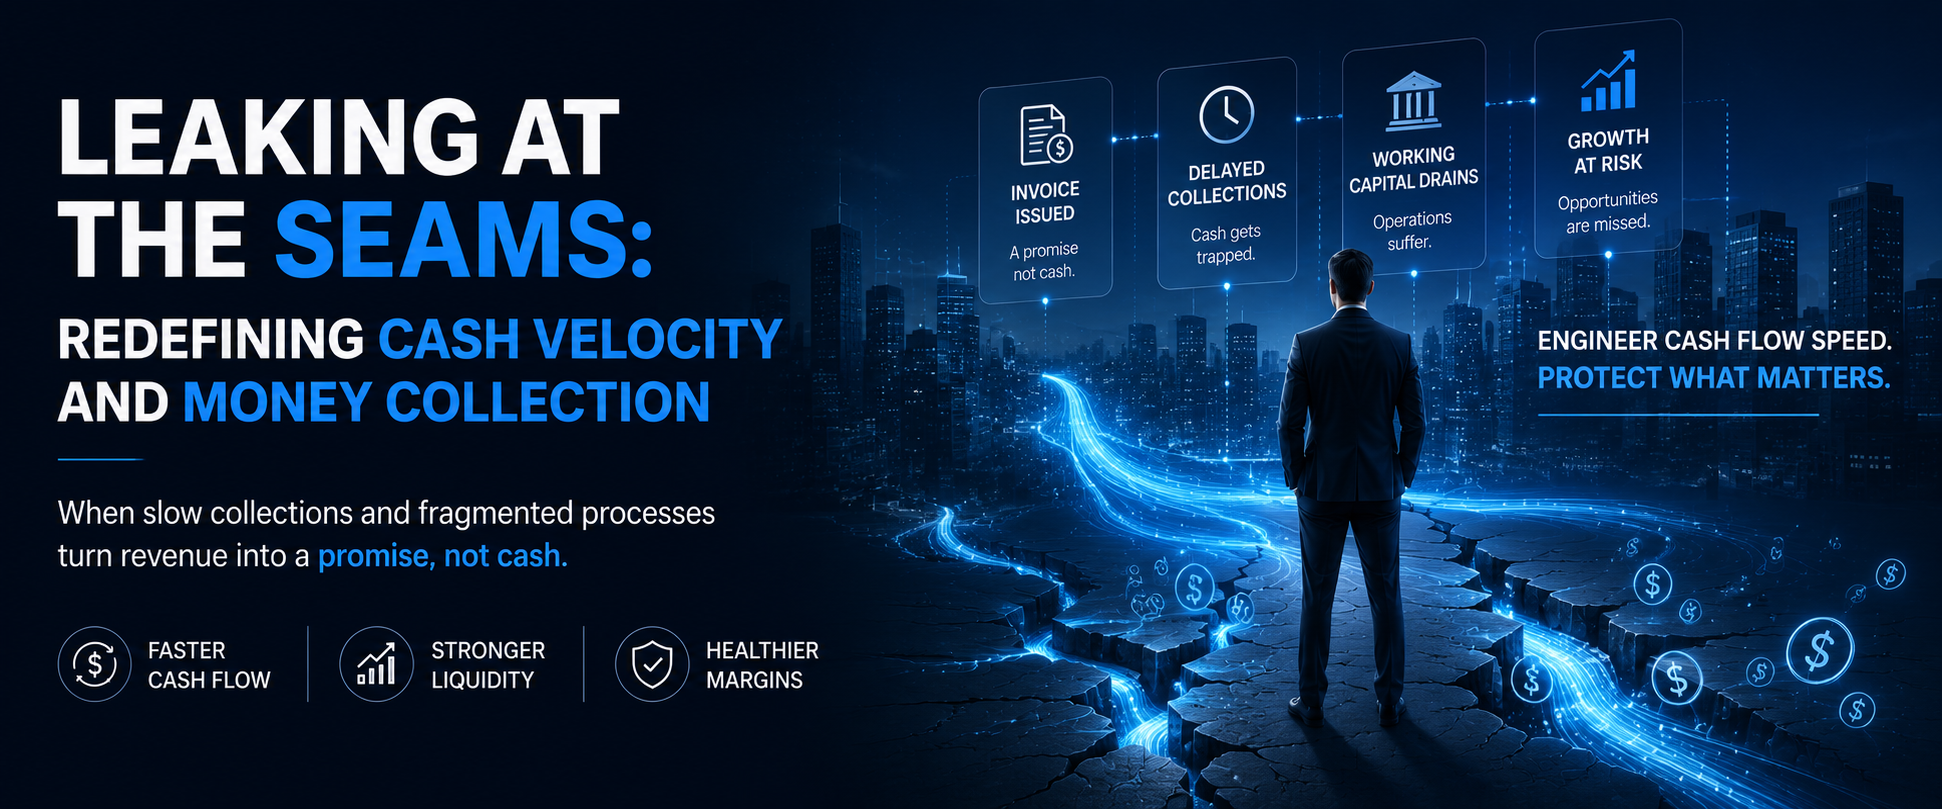
This structural contradiction stems from a fundamental flaw in mid-market accounting architecture: the confusion between booked revenue and realized liquidity. An invoice issued is merely an accounting entry, a promise of capital that carries zero purchasing power until it clears the banking network. When accounts receivable (AR) drag out over weeks and months, working capital dries up, credit lines expand, and interest expense erodes net profit margins.
While total cash velocity across an enterprise encompasses the entire Cash Conversion Cycle—balancing Inventory (Days Inventory Outstanding / DIO), Accounts Payable (Days Payable Outstanding / DPO), and Accounts Receivable (Days Sales Outstanding / DSO)—the Order to Cash (O2C) engine is where mid-market companies lose the most control. By treating cash collection as an administrative back office task rather than a hardcoded operational workflow, growing enterprises allow millions in liquidity to leak through the seams of their financial architecture.
To protect margins in a volatile economic environment, CFOs must move beyond passive collection tactics and re-engineer enterprise software to accelerate cash velocity.
The Macro Economics of Trapped Working Capital
To understand why receivables drag down enterprise valuation, leadership must first measure the sheer scale of uncollected debt across global supply networks.
According to extensive research by The Hackett Group — Working Capital Survey, the top 1,000 public nonfinancial companies alone hold over $1.7 trillion in trapped working capital. Accounts receivable accounts for the largest share of this trapped liquidity, with an 18 day gap between average and top quartile performers representing a $600 billion cash release opportunity.1
This cash flow bottleneck is further compounded by deteriorating payment terms across global markets. Research from Allianz Trade — Late Payment Trends & Working Capital Report
reveals that global Days Sales Outstanding (DSO) has climbed to an average of 59 days, with one in five enterprises waiting over 90 days to collect outstanding receivables.2
| Metric | Global Benchmark | Financial & Operational Impact |
|---|---|---|
| Trapped Working Capital | $1.7 Trillion Total (The Hackett Group) |
Restricts self-funded growth and forces reliance on expensive debt markets. |
| Receivables Opportunity | $600 Billion Cash Release (The Hackett Group) |
Directly recoverable cash tied up in an 18-day DSO collection performance gap. |
| Average Collection Window | 59 Days Global DSO (Allianz Trade) |
Inflates interest expense, degrades cash velocity, and increases bad debt risk. |
| Severe Late Payments | 20% Facing 90+ Day Delays (Allianz Trade) |
Triggers severe operational liquidity squeezes and limits capital deployment. |
When cash cycles stretch to nearly two full months, the enterprise essentially functions as an unsecured, interest free bank for its customer base.
The Complete Mechanics of Cash Velocity: The Cash Conversion Cycle
True cash velocity measures how efficiently an enterprise turns operational investments back into liquid cash. This lifecycle is formally governed by the Cash Conversion Cycle (CCC):
· Days Inventory Outstanding (DIO): The average number of days capital remains tied up in physical inventory before sale.
· Days Sales Outstanding (DSO): The average number of days required to collect cash after a sale is completed.
· Days Payable Outstanding (DPO): The average number of days the business takes to settle its own obligations to suppliers.
While procurement manages DPO and logistics manages DIO, the Order to Cash (O2C) pipeline controls DSO. When DSO inflates due to billing friction, the entire Cash Conversion Cycle expands, forcing the company to fund its operations using external credit lines or equity.
Quantifying the ROI of DSO Reduction: The 65 to 45 Day Impact
To visualize the tangible return on investment (ROI) of automated O2C governance, consider a mid-market enterprise generating $100 million in annual revenue with a baseline DSO of 65 days.
Compressing DSO by 20 days (from 65 days down to 45 days) unlocks direct financial value across three areas:
1. Immediate Working Capital Release:
Daily revenue for a $100 million business is approximately $273,972. Cutting 20 days of collection delay permanently unlocks $5.48 million in cash flow directly onto the balance sheet.
2. Interest Expense Savings:
At an 8% cost of capital or credit facility rate, holding an extra $5.48 million in liquidity saves $438,356 annually in direct interest costs.
3. Bad Debt Expense Reduction:
According to PwC’s Global Working Capital Study, prolonged DSO reflects declining payment morale and inefficient cash conversion, both of which constrain liquidity and weaken enterprise resilience. Rather than accepting extended collection cycles as an inevitable cost of doing business, organizations that improve receivables performance release working capital back into the business, enhance cash predictability, and reduce their exposure to credit-related financial stress. 3
When Cash Outpaces Profit
The importance of cash velocity is not merely theoretical; it has shaped the fortunes of some of the world’s most recognizable companies. Walmart and Amazon transformed working capital into a competitive advantage by consistently collecting cash from customers before paying suppliers, creating a negative cash conversion cycle that generated liquidity to fund expansion and innovation. Toys “R” Us, by contrast, generated billions of dollars in annual revenue and remained a globally recognized retailer, yet persistent cash flow constraints and heavy debt obligations left the company unable to finance its operations or adapt to a changing market. The lesson for executives is clear: profitability measures how much value a business creates, but cash velocity determines how quickly that value can be reinvested to sustain growth. Organizations rarely fail because profit appears too slowly on the income statement; they fail because cash arrives too late to support the business.4 5
The Hidden Cost of Payment Friction: Quantifying Revenue Leaks
While CFOs often view late payments as a simple negotiation issue with buyers, technical data proves that internal process friction is the primary driver of delayed collections.
When billing systems are disconnected from warehouse fulfillment, or when credit approvals require manual email sign offs, invoicing errors multiply. A single incorrect line item, disputed freight charge, or missing purchase order number gives buying organizations a valid reason to pause payment processing.
An empirical study by PYMNTS Intelligence — Middle Market Payment Friction Study reveals that mid-market companies experiencing recurring payment friction lose 192 basis points (1.92%) of total annual revenue to operational delays, administrative errors, and uncollected debt. 6
The Cost of Internal Billing Friction
- Friction Light Enterprises: Absorb a minimal 31 basis points (0.31%) in payment performance loss (PYMNTS Intelligence).
- High Friction Enterprises: Suffer a devastating 192 basis points (1.92%) revenue loss directly attributable to manual approval steps, unaligned billing tools, and payment blind spots (PYMNTS Intelligence).
- The Net Performance Gap: The difference between high friction and friction light operations represents a net loss of 161 basis points (1.61%).
For a $100 million mid-market enterprise, this 1.61% net performance gap represents $1.61 million in annual bottom line erosion, money that evaporates entirely due to fragmented back office systems.
The Anatomy of an Uncollected Receivable: Four Structural Leaks
Revenue leaks rarely occur through catastrophic customer defaults. Instead, they materialize through four distinct structural breakdowns along the credit to cash pipeline:
· Customer Order Stage → 1. Unchecked Credit Limits at Order Entry
Commercial sales reps enter new orders without real time visibility into customer credit balances. If an account is past due, the order enters production anyway, expanding financial exposure before finance teams notice the risk.
· Fulfillment Stage → 2. Invoice Generation Lag
When warehouse management tools do not immediately communicate with the accounting ledger upon shipment, billing departments generate invoices days or weeks after fulfillment. This latency delays the legal payment clock from starting.
· Payment Due Stage → 3. Unresolved Deduction Traps
When a customer short pays an invoice due to a partial shipment or damaged goods, the dispute sits in an email thread between customer service and sales. Without an automated workflow to route deductions for immediate verification, the entire invoice remains uncollected.
· Collections Stage → 4. Spreadsheet Driven Dunning
Collection teams spend hours manually cross referencing aging reports in static spreadsheets, prioritizing accounts based on intuition rather than predictive risk scoring. High value past due accounts go uncontacted, while low risk accounts receive redundant reminders.
Hardcoding Cash Velocity: The ERP Automation Paradigm
Plugging these financial leaks requires eliminating manual intervention across the Order to Cash cycle. Modern Enterprise Resource Planning (ERP) engines transform cash collection from a reactive chase into an automated operational discipline.
Benchmark analytics from McKinsey & Company — McKinsey Cash Solutions indicate that organizations deploying automated financial workflows and granular transaction analytics capture a 10% to 30%+ net working capital improvement over baseline operating conditions.7
The Unified ERP Financial Core
1. Real Time Credit Rules → Hardcoded order hold enforcement prevents unauthorized credit extensions before fulfillment begins.
2. Automated Proof of Delivery → Instant digital invoice dispatch accelerates the start of the collection clock upon warehouse scan.
3. Automated Escalation Pathways → Targeted risk scoring and rules based dunning eliminate reliance on manual aging spreadsheets.
Hardcoding financial rules into the unified ERP architecture institutes three fundamental operational shifts:
1. Automated Order Holds: The ERP automatically blocks new shipments to accounts exceeding credit limits or carrying 60+ day past due balances, forcing commercial alignment with risk policies without manual accounting intervention.
2. Instant Trigger Invoicing: The moment a warehouse operator completes a digital scan at the loading dock, the ERP automatically generates and dispatches an electronic invoice with embedded digital payment capabilities, cutting invoicing lag to zero.
3. Rules Based Dispute Resolution: Deductions automatically trigger an internal review workflow, assigning tasks to logistics or quality assurance teams with strict time bounds to prevent unresolved line items from stalling full invoice payment.
Global trend research from PwC UK — Global Working Capital Study confirms that Days Sales Outstanding accounts for the largest controllable variation in corporate cash cycles, proving that tightening collection discipline through automated workflow rules is the fastest lever to unlock internal liquidity.8
The Operational Transformation: Key Metrics Before and After ERP Integration
Research on C-Suite priorities by Gartner — CFO Agenda & Finance Transformation Survey reveals that while 56% of CFOs rank cost optimization as their top priority, fewer than 36% feel confident in their execution of digital finance automation. 9
Transitioning from manual workarounds to a hardcoded ERP core shifts core operating workflows across four critical control areas:
- Credit Risk Management: Shifts from periodic manual reviews and bypassed order limits to real time credit evaluations at order entry backed by hardcoded system holds.
- Invoicing Speed: Shifts from batch invoice processing with 3 to 7 day fulfillment lags to instant electronic invoicing triggered upon automated proof of delivery.
- Deduction & Dispute Handling: Shifts from disconnected email threads and delayed resolution to automated workflow routing with mandatory resolution timeframes.
- Collections Management: Shifts from static aging spreadsheets and reactive phone calls to automated risk scoring and dynamic dunning sequences.
Below is the measured impact on enterprise performance metrics when executing this transition to an integrated ERP financial core:
| Key Performance Indicator (KPI) | Baseline (Before ERP) | Automated ERP Core (After ERP) | Operational Impact |
|---|---|---|---|
| Days Sales Outstanding (DSO) | 68 Days | 42 Days | 26-Day Reduction in collection window |
| Invoice Accuracy Rate | 92.0% | 99.7% | 7.7% Increase (Eliminates dispute holds) |
| Collection Rate | 81.0% | 95.0% | 14.0% Increase in on-time recovery |
| Working Capital Optimization | Baseline | 18.0% Improvement | Liquidity Release across operations |
| Cash Conversion Cycle (CCC) | 74 Days | 49 Days | 25-Day Acceleration in enterprise cash flow |
Relying on manual workarounds to manage receivables creates an artificial ceiling on growth. As transaction volumes expand, administrative overhead scales linearly while cash velocity continues to degrade.
Executive Mandate: Transforming Receivables into Enterprise Velocity
Cash velocity is not an isolated finance department metric; it is the ultimate measure of organizational efficiency.
Every day an invoice sits uncollected, enterprise capital deteriorates in value. By replacing fragmented accounting software with a unified, hardcoded financial core, executive leadership eliminates structural revenue leaks, lowers capital costs, and converts trapped accounts receivable into active liquidity.
Before approving next quarter’s treasury budget or expanding working capital credit lines, the C-Suite must address a foundational question:
Is our cash collection strategy built on chasing past due invoices, or have we engineered an enterprise architecture that guarantees cash flow speed?