
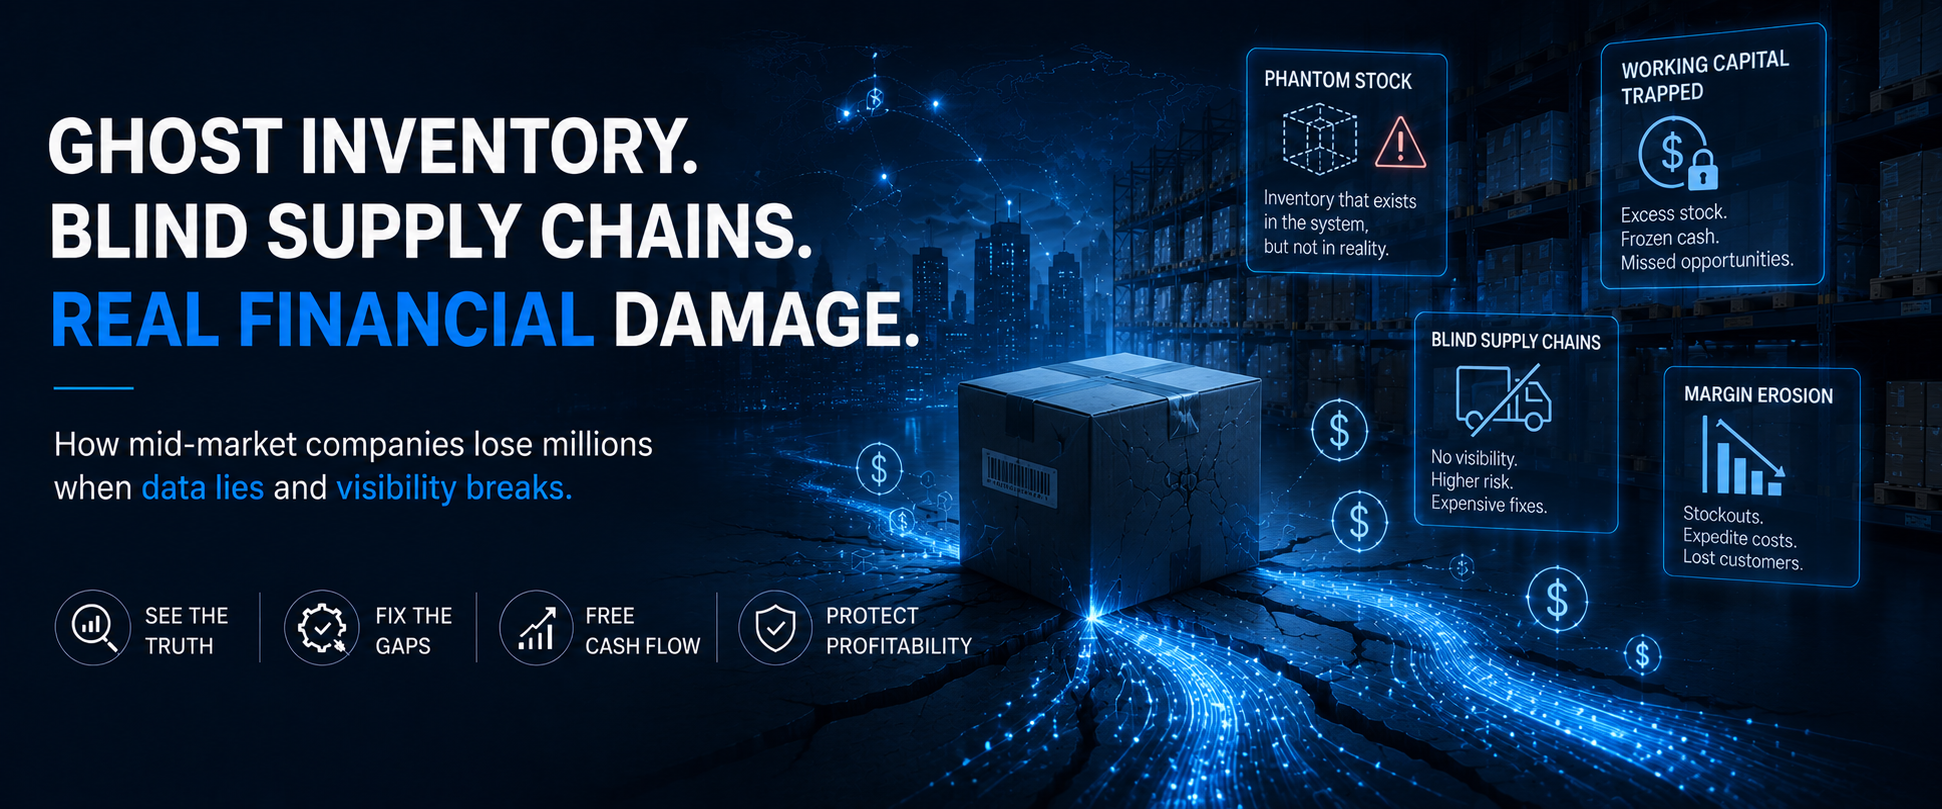
In mid-market manufacturing, distribution, and commercial execution, few operational anomalies are as financially toxic as a warehouse system that lies to its executive leadership.
On a balance sheet, inventory appears as a liquid asset, a tangible representation of working capital awaiting conversion into realized revenue. On the operational floor, however, that asset frequently dissolves into an illusion. A digital record indicates that twelve units of a high margin component sit in Bin B14, yet a physical audit reveals an empty pallet. Conversely, forty units of an obsolete finished product sit unaccounted for in a secondary staging area, completely invisible to the commercial teams actively placing backorders.
This disconnect represents more than an administrative nuisance. It is the manifestation of Ghost Inventory (or phantom stock) and Blind Supply Chains, the dual structural traps that systematically drain working capital across mid-market enterprises.
While enterprise conglomerates deploy capital to absorb data discrepancies through sheer scale, mid-market companies possess no such luxury. Operating with leaner margins and tighter liquidity, mid-market organizations suffer exponentially greater damage when physical reality and digital records diverge. Resolving this challenge requires moving beyond manual cycle counts to examine the architectural breakdowns that create digital fog across the supply network.
The Anatomy of Inventory Distortion
To understand how inventory distortion accumulates, leadership must first dismantle the myth that stock accuracy is purely a warehouse management discipline. Inventory distortion, the aggregate financial metric encompassing both out of stock events and overstock positions, is the direct structural output of fragmented enterprise planning.
A landmark global research study by the IHL Group quantifies the global impact of this operational disconnect at $1.73 trillion annually, representing approximately 6.5% of total retail and distribution sales. 1
| Failure Category | Annual Global Loss | Operational Mechanics & Financial Risk |
|---|---|---|
| Out of Stock Losses | $1.157 Trillion | Silent order freezing, customer churn, and artificially suppressed demand forecasts. |
| Overstock Holding Costs | $572 Billion | Capital tied up in obsolete stock, margin diluting markdowns, and storage fees. |
Crucially, this distortion does not stem from a total absence of operational software. Rather, it emerges from the architectural gap between disconnected transaction layers, where the Point of Sale (POS), Warehouse Management System (WMS), Enterprise Resource Planning (ERP) core, and procurement modules run on independent schedules and unaligned data definitions.
The Root Cause: Master Data Corruption and MRP Misalignment
While warehouse floor errors are often blamed for phantom stock, the underlying driver of digital ghost inventory is systemic Master Data Management (MDM) corruption and faulty Material Requirements Planning (MRP) configuration.
When core data schemas are unaligned across systems, physical stock instantly transforms into digital noise:
- SKU Duplication: When identical parts are assigned multiple stock keeping unit identifiers across legacy databases or acquired systems, inventory becomes fragmented. The system shows zero stock for SKU-A while SKU-B accumulates dust in a secondary bin, triggering unnecessary purchase orders for items already sitting in the warehouse.
- Unit of Measure (UOM) Mismatches: Systemic variance between buying UOMs (for example, cases or pallets) and stocking or selling UOMs (for example, individual units or eaches) creates massive stock discrepancies. If a receiving clerk logs a pallet of 100 units as a single receiving unit, the ERP registers one item while the floor holds 100, paralyzing automated replenishment.
- Inaccurate Location and Bin Mapping: When warehouse location hierarchies in the ERP fail to mirror physical layout changes, workers cannot locate received inventory. The system considers the product on hand, but fulfillment teams mark it missing, forcing redundant picking routes and artificially high safety stock reserves.
These master data failures directly corrupt the Material Requirements Planning (MRP) engine. Modern ERP systems rely on accurate Bills of Materials (BOMs), lead time parameters, and inventory on hand balances to compute net material requirements.
When MRP feeds on corrupted master data or inaccurate stock counts, it executes faulty gross-to-net calculations. The system either fails to issue purchase requisitions for critical production components or triggers bulk purchasing for materials already overstocked under duplicate SKUs, locking up capital in inventory that cannot be used.
The Mechanics of Phantom Stock: How the Silent Killer Operates
Ghost inventory occurs when an enterprise system’s digital ledger reflects available stock for an SKU, but the physical product is missing, damaged, stolen, or misplaced.
The true operational danger of phantom stock lies in its self perpetuating nature. Modern enterprise architecture relies heavily on automated reorder points (ROPs) and Min Max inventory replenishment algorithms. When phantom stock enters the system, it triggers a catastrophic sequence of silent failures:
- Reorder Point Freezing: Because the digital system believes five units remain in stock, the inventory level stays above the automated replenishment threshold. The system never issues a purchase order (PO) to the supplier.
- Artificial Demand Suppression: Commercial channels show the item as available. Customers attempt to order, experience fulfillment cancellations, and migrate to alternative vendors. Because no order was booked, the forecasting engine registers zero demand, treating the lack of sales as a decline in market interest rather than a stockout.
- Forecast Corruption: Historical sales data, now artificially depressed by unrecorded stockouts, corrupts future baseline forecasts. The algorithm systematically reduces future purchasing volumes for high margin items, compounding stockouts in subsequent planning cycles.
Industry data from SPS Commerce highlights the severity of this breakdown, noting that 66% of buyers immediately switch to a competitor when an item listed as available online fails at checkout. The organization does not merely lose a single transaction; it absorbs long term customer churn while its replenishment algorithms remain digitally paralyzed. 2
Blind Supply Chains and Multi Tier Opacity
If ghost inventory represents internal data corruption, the Blind Supply Chain represents external operational blindness.
Mid-market enterprises frequently operate with reasonable visibility into their immediate, Tier 1 suppliers. However, operational vulnerability accelerates rapidly as dependencies move into Tier 2 raw material suppliers and Tier 3 sub component manufacturers.
Global supply chain research conducted by McKinsey & Company reveals a stark operational paradox: while 90% of supply chain executives experienced severe operational disruptions in recent operating cycles, only 7% possessed real time, end to end network visibility across their operational ecosystems. 3
This visibility gap creates severe financial liabilities that manifest across three primary operational vectors:
- The Safety Stock Cushion (Working Capital Bloat)
Lacking real time telemetry on inbound material flows, supply chain managers compensate for uncertainty by establishing bloated “safety stock” buffers. Carrying excess inventory as a hedge against supply chain opacity incurs substantial raw holding, insurance, capital, and handling costs, directly tying up working capital on the balance sheet. 4
2. Expedited Logistics Costs (Margin Erosion)
When an unmonitored Tier 2 disruption delays a critical production run, management routinely resorts to emergency measures. Premium air freight costs run significantly higher than standard logistics lanes. Improving supply chain visibility allows manufacturers to reduce expedited freight costs by 30% to 50%, turning visibility into a direct margin protection tool. 5
3. Landed Cost Variance
Without real time data integration across Third Party Logistics (3PL) partners and freight carriers, procurement teams calculate margins using estimated landed costs rather than actual expenditures. Customs tariffs, demurrage fees, and fuel surcharges hit the ledger weeks after product delivery, creating unexpected margin compression during monthly financial reconciliation.
Executive Diagnostic: Benchmarking Supply Chain Telemetry
To assess whether an organization is caught in the mid-market operational trap, executive teams can benchmark their supply chain metrics against industry standards established by the Aberdeen Group and McKinsey & Company:
| Operational Metric | Siloed & Fragmented Enterprise | Top Quartile Integrated Enterprise | Financial Impact of the Gap |
|---|---|---|---|
| Inventory Accuracy Rate | 65% to 75% (Frequent audit adjustments) |
95% to 99%+ (Continuous RFID/WMS integration) |
Eliminates phantom stock, reduces write-offs, and restores automated replenishment. |
| Supplier On-Time Delivery (OTD) | Under 75% (Low Tier 2 and 3 visibility) |
94%+ (Synchronized EDI/Supplier Portals) |
Direct reduction in raw material stockouts and production line downtime. |
| Inventory Turns | 3.0x to 4.5x annual turns | 15% to 20% Improvement over baseline | Substantial release of tied-up working capital directly to the balance sheet. |
| Expedited Logistics Spend | High, variable, absorbed into COGS | 30% to 50% Reduction in emergency freight | Direct margin protection and elimination of spot market freight premiums. |
The Mid-Market Operational Trap: Why Point Solutions Fail
Faced with ghost inventory and supply chain opacity, mid-market organizations frequently fall into the Point Solution Trap.
Leadership recognizes a specific symptom and purchases a dedicated software tool to address it: a standalone WMS for the warehouse, a specialized demand forecasting tool for planning, or an independent tracking application for logistics.
While each application performs adequately within its narrow domain, this approach duplicates the exact architectural flaws that created the problem. The organization builds an expensive cluster of functional silos, each maintaining its own database schema, synchronization schedule, and data assumptions.
Architectural Comparison: Siloed vs. Unified
- Fragmented Point Solutions: Disconnected POS, WMS, and 3PL applications → CSV/API Middleware Gap (Information Entropy) → Delayed Batch Processing → Corrupted Master Data & Ghost Inventory.
- Unified Operational Core: Unified ERP & MRP Engine (Single Source of Truth) → Real Time Telemetry & Clean Master Data → Synchronized Stock, Orders, & Inbound Freight.
When a warehouse operator scans an item in a standalone WMS that uses unaligned Units of Measure or duplicate SKU definitions, that transaction corrupts the core ERP database. In that intervening window, a commercial sales rep quotes that same inventory to a key client. The
company has not solved ghost inventory; it has simply accelerated the speed at which corrupted data moves between disconnected screens.
Real time telemetry cannot be retrofitted through superficial software overlays. It requires an underlying enterprise architecture where master data, MRP calculations, inventory movements, purchase orders, logistics updates, and financial ledgers execute against a single source of truth.
Strategic Reorientation: From Asset Holding to Flow Control
Overcoming the mid-market operational trap requires a fundamental shift in executive mindset.
Inventory must no longer be viewed as a static asset sitting on warehouse shelves. It must be governed as a continuous flow of capital moving through a synchronized value stream. High master data integrity, aligned MRP execution, and end to end supply chain visibility are not merely operational IT metrics; they represent primary levers for working capital optimization and margin defense.
When leadership eliminates data latency and master data discrepancies between physical execution and digital records, phantom stock vanishes. Reorder algorithms and MRP engines function as designed, safety stock buffers collapse, emergency freight expenses drop, and capital tied up in excess stock returns directly to the balance sheet to fund strategic growth.
Before authorizing another software purchase or expanding safety stock margins, executive leadership must confront a core operational question:
Does our enterprise architecture enforce clean master data and real-time MRP visibility into our physical inventory right now, or are we making multi-million dollar decisions based on duplicate SKUs and corrupted digital records?